Radiation Dose Chart: How to Read mSv, rem, and Risk
Radiation dose chart guide: compare mSv, rem, Gy, symptoms, and emergency action thresholds before you act.
Staff Reporting and Analysis. Produces source-backed reporting, explainers, and reference pages on nuclear risk, proliferation, and escalation dynamics.
Key Sources
Start with the strongest supporting documents and reporting behind this page.
Where This Matters Now
Recent articles where this concept is actively shaping the current crisis.
In Current Coverage
Hiroshima and Nagasaki: What Happened When the Bombs Fell
On August 6 and 9, 1945, U.S. atomic bombs devastated Hiroshima and Nagasaki. Here is what happened, who died, and what radiation did after.
2026-03-03
In Current Coverage
Tsar Bomba: The Biggest Nuclear Weapon Ever Tested
Tsar Bomba, tested by the Soviet Union on October 30, 1961, yielded about 57 megatons, becoming the most powerful man-made explosion ever recorded.
2026-03-03
In Current Coverage
What Would Happen If Nuclear War Started? A Step-by-Step Guide
What happens if nuclear war starts? From first launch to nuclear winter: blast zones, fallout, infrastructure collapse, and long-term survival risks.
2026-03-03
Related Concepts
Companion explainers that deepen the strategic logic around this topic.
Concept
Nuclear Fallout Map: How to Read One
Nuclear fallout map guidance: read wind plumes, timing, and shelter zones without false certainty. Learn the signals that matter.
2026-05-13
Concept
Nuclear Flash Blindness Distance: Safety Guide | NukeClock
Nuclear flash blindness distance explained: day vs night ranges, eye injury risk, and immediate actions that reduce harm after a nuclear detonation.
2026-05-11
Concept
Does Duck and Cover Work? What Physics Says
Does duck and cover work in a nuclear attack? It can reduce blast injuries, but only when paired with immediate indoor shelter and fallout protection.
2026-04-12
Radiation dose chart searches usually come from one practical problem: a number appears in mSv, rem, Gy, rad, uSv/h, or R/hr, and you need to know whether it describes routine exposure, a regulatory limit, or an urgent health hazard. The answer depends on unit, time, body area, radiation type, and whether the number is cumulative dose or dose rate. That is why a chart is useful, but only if it keeps everyday exposure, workplace limits, fallout decisions, and acute radiation syndrome in separate lanes.
What does a radiation dose chart measure?
A radiation dose chart measures potential biological impact, not just the presence of radioactive material. That distinction matters because a Geiger counter can show activity nearby, a contamination survey can show particles on a surface, and a dosimeter can track accumulated dose to a person. Those are related measurements, but they do not answer the same question.
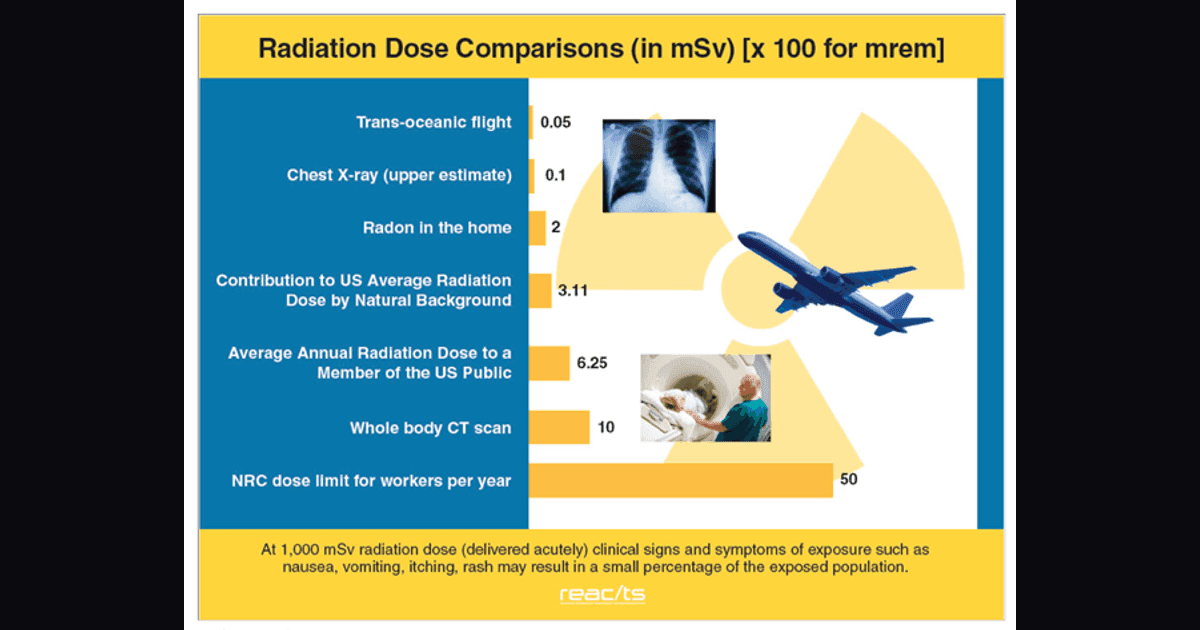
The Department of Energy dose ranges chart exists to compare exposure across natural, medical, occupational, and emergency contexts. The reason the chart spans many orders of magnitude is that radiation dose is not one narrow category. Background exposure, a chest x-ray, an occupational annual limit, a CT scan, and a severe acute exposure can all be real radiation doses while implying very different decisions.
The three chart questions to ask first
| Question | Why it matters | Example |
|---|---|---|
| Is this dose or dose rate? | Dose accumulates; dose rate describes speed | mSv vs mSv/h |
| Is this whole body or local tissue? | Whole-body dose maps better to systemic risk | Hand exposure vs torso exposure |
| Is this acute or chronic? | Short-time exposure is more likely to cause immediate injury | Minutes vs a year |
If those details are missing, the number is incomplete. A screenshot saying "2 mSv" is less useful than a plain sentence saying "2 mSv whole-body effective dose accumulated over one year."
How do mSv, rem, Gy, and rad convert?
The shortest conversion rule is this: sievert and rem are commonly used for equivalent or effective dose to people, while gray and rad are absorbed-dose units. The EPA radiation terms and units guide gives the basic conversions: 1 sievert equals 100 rem, 1 rem equals 0.01 sievert, 1 gray equals 100 rad, and 1 rad equals 0.01 gray.
Common radiation unit conversions
| Unit shown | Convert to | Practical reading |
|---|---|---|
| 1 Sv | 100 rem | Large whole-body dose scale |
| 1 mSv | 100 mrem | Common public-health comparison unit |
| 1 rem | 10 mSv | Common U.S. radiation-protection unit |
| 1 mrem | 0.01 mSv | Small-dose U.S. comparison unit |
| 1 Gy | 100 rad | Absorbed dose, often used for acute injury |
| 1 rad | 0.01 Gy | Traditional absorbed-dose unit |
For gamma rays and x-rays, absorbed dose and equivalent dose can be numerically close because the radiation weighting factor is 1. For alpha particles, neutrons, and mixed fields, you need more context. A simple dose chart should not imply that every radiation type maps cleanly to one health effect without adjustment.
Do not mix dose units with activity units
Becquerels and curies describe radioactive decay activity. Sieverts, rem, grays, and rads describe dose or absorbed energy. A material can have high activity but produce a lower personal dose if shielding, distance, and exposure time are controlled.
How many mSv is normal in a year?
The NRC daily-lives dose page lists average U.S. annual exposure at about 620 mrem, which is 6.2 mSv. Roughly half comes from natural background sources such as radon, cosmic rays, and terrestrial radiation, while the other half comes from man-made sources, especially medical procedures.
That average does not mean every person receives exactly 6.2 mSv. Location, elevation, radon levels, medical imaging, work, travel, and personal health history can move the number. A person who has no CT scans and low indoor radon may sit below the average. A person with multiple medically necessary scans may exceed it without that automatically meaning an emergency.
Everyday and medical dose reference points
| Exposure or limit | Approximate dose | What it means |
|---|---|---|
| Chest x-ray | 10 mrem / 0.1 mSv | Low single medical exposure |
| Full-body CT in NRC table | 1,000 mrem / 10 mSv | Larger diagnostic exposure |
| Average U.S. annual dose | 620 mrem / 6.2 mSv | Natural plus man-made average |
| NRC public limit from licensees | 100 mrem / 1 mSv per year | Limit for NRC-regulated operations, not medical care |
| NRC occupational adult limit | 5,000 mrem / 50 mSv per year | Worker limit under monitored controls |
These rows should not be used as a self-diagnosis tool. Medical imaging is justified by clinical benefit; emergency exposure decisions are justified by immediate life safety; occupational limits assume training, monitoring, and controls.
What radiation dose is dangerous?
A dangerous radiation dose depends on delivery speed and body coverage. Low doses spread over long periods mainly raise long-term risk questions. Very high whole-body doses delivered over minutes to hours can cause acute radiation syndrome, which is a different category of harm.
CDC clinician guidance says acute radiation syndrome generally requires a large, penetrating, short-time dose to the whole body or a significant portion of it. The same CDC page states that the dose must usually be greater than 0.7 Gy, or 70 rads, with mild symptoms possible at lower doses in some cases. It separates major syndromes by dose range: bone marrow syndrome around 0.7 to 10 Gy, gastrointestinal syndrome generally above 10 Gy, and cardiovascular/central nervous system syndrome above about 50 Gy.
Acute whole-body dose chart
| Short-time whole-body dose | Approximate equivalent in rad | Main concern |
|---|---|---|
| Under 0.1 Gy | Under 10 rad | Usually no immediate symptoms; long-term risk depends on context |
| 0.3 Gy | 30 rad | Mild symptoms may occur in some exposed people |
| 0.7 Gy | 70 rad | CDC threshold area for full ARS concern |
| 1-2 Gy | 100-200 rad | Medical evaluation needed; symptoms and blood changes possible |
| 2.5-5 Gy | 250-500 rad | CDC lists this as an LD50/60 range without supportive care assumptions |
| Above 10 Gy | Above 1,000 rad | Severe GI syndrome range; survival is extremely difficult |
For a symptom-by-symptom timeline, use Radiation Sickness Symptoms Timeline: Hour-by-Hour Warning Signs. This page is about interpreting numbers; that page is about what those numbers can look like over time.
How do dose rate and time change the chart?
Dose rate is dose per unit time. If a meter reads 10 uSv/h and you remain there for one hour, the rough external dose is 10 uSv. If you remain for ten hours at the same rate, it becomes 100 uSv. Real conditions can change, especially after fallout, but the time relationship is the core idea.
Dose-rate math for fast interpretation
| Meter reading | Time exposed | Approximate dose |
|---|---|---|
| 1 uSv/h | 10 hours | 10 uSv / 0.01 mSv |
| 10 uSv/h | 10 hours | 100 uSv / 0.1 mSv |
| 100 uSv/h | 10 hours | 1,000 uSv / 1 mSv |
| 1 mSv/h | 10 hours | 10 mSv |
| 100 mSv/h | 10 hours | 1,000 mSv / 1 Sv |
The table assumes the rate stays constant. Fallout does not behave that cleanly. In many fallout scenarios, dose rates drop rapidly over time, which is why How Long Does Nuclear Fallout Last? A Practical Timeline focuses on decay, shelter timing, and the first 24 to 48 hours.
How should you read radiation measurements after fallout?
After a nuclear detonation or radiological release, a radiation dose chart should guide priorities, not replace official instructions. Your first decision is still physical protection: get inside, increase shielding, reduce contamination transfer, and wait for verified updates. That sequence is covered in What to Do During Nuclear Alert: A 24-Hour Action Protocol.
Fallout readings can be confusing because instruments may report exposure rate, dose rate, accumulated dose, count rate, or contamination. They may also be calibrated for particular radiation types. A consumer meter showing counts per minute is not the same as a personal dosimeter reporting accumulated mSv.
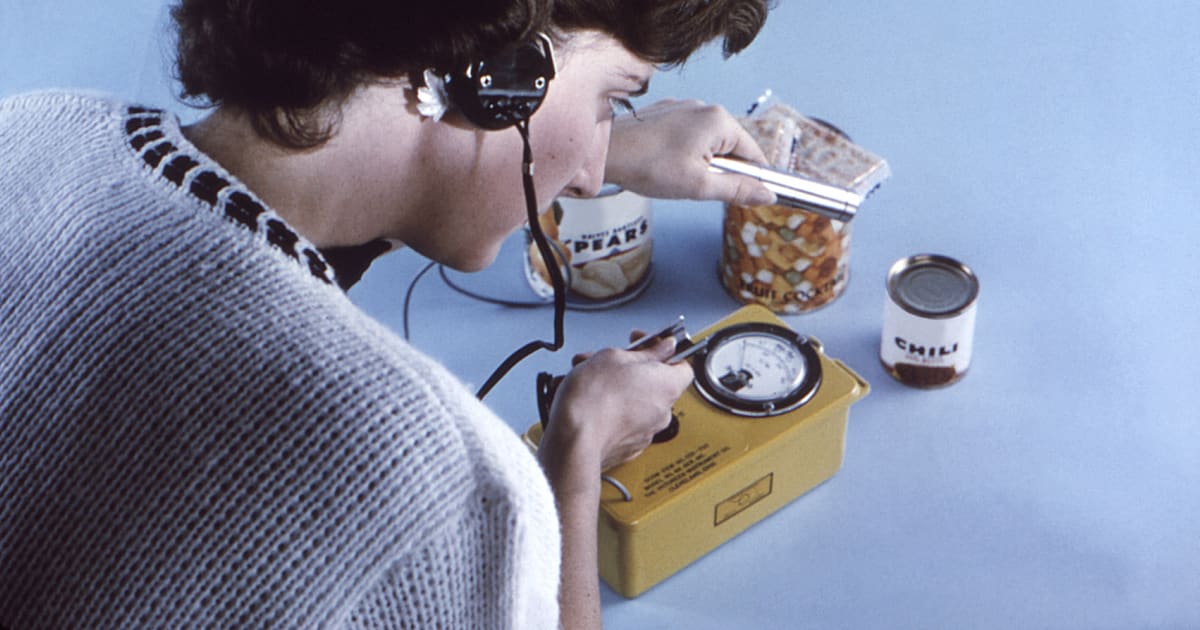
Field instruments help officials turn contamination and dose-rate readings into protective-action zones. Source image: CDC Public Health Image Library via Wikimedia Commons.
Fallout reading triage
| Reading type | What it can tell you | What it cannot tell you alone |
|---|---|---|
| uSv/h or mSv/h | Dose rate at the detector location | Total dose unless time is known |
| Accumulated mSv | Dose received by that dosimeter | Future dose if conditions change |
| Counts per minute | Detector response to radiation events | Reliable health dose without calibration context |
| Surface contamination | Particles on an object or person | Whole-body dose without exposure pathway |
If you were outside in suspected fallout, the number on a meter is only one part of risk reduction. The immediate practical steps are still to remove outer clothing, wash exposed skin and hair, isolate contaminated items, and avoid spreading dust indoors. For the detailed sequence, use How to Decontaminate After Nuclear Fallout.
How do regulatory limits differ from emergency thresholds?
Regulatory limits are designed for controlled, routine settings. Emergency thresholds are designed for crisis tradeoffs. Mixing them creates confusion. A 1 mSv annual public limit from regulated operations is not a claim that 1.1 mSv is an immediate medical emergency. A 10-50 mSv projected emergency protective-action range is not a casual target for normal life.
The EPA notes that effective dose is used for long-term health-risk comparisons and regulatory limits. Its terms page also references protective-action guidance where sheltering or evacuation decisions can be triggered by a projected dose range over several days. That framework exists because emergency managers must weigh radiation reduction against evacuation risks, medical needs, traffic, weather, infrastructure, and shelter quality.
Different dose numbers for different decisions
| Number type | Typical use | Decision mistake to avoid |
|---|---|---|
| Annual public limit | Routine regulated exposure | Treating it as an instant danger line |
| Occupational limit | Monitored trained work | Applying it to untrained public exposure |
| Projected emergency dose | Shelter or evacuation planning | Self-evacuating without route guidance |
| Acute whole-body dose | Medical triage and ARS concern | Comparing it casually to dental x-rays |
For household planning, Nuclear Shelter Checklist: 24-Hour Plan is the more useful companion than a regulatory table. The chart tells you how to read the numbers; the checklist tells you how to execute.
What mistakes make radiation dose charts misleading?
Radiation charts mislead when they collapse too many contexts into one visual ladder. A banana, a chest x-ray, a CT scan, an annual worker limit, and an acute whole-body dose can appear on the same axis, but they differ by radiation type, body area, duration, and medical benefit.
Common chart-reading errors
| Mistake | Why it fails | Better reading |
|---|---|---|
| Comparing local skin dose to whole-body dose | Health effects differ by tissue and coverage | Ask what body area received the dose |
| Ignoring time | Dose rate drives urgency | Convert rate x time before reacting |
| Treating medical dose as avoidable hazard only | Medical benefit may outweigh radiation risk | Discuss clinical necessity with a clinician |
| Reading counts per minute as mSv | Detector response is not automatically dose | Use calibrated dose-rate readings |
| Treating regulatory limits as symptom thresholds | Limits are conservative planning tools | Separate legal limits from acute injury levels |
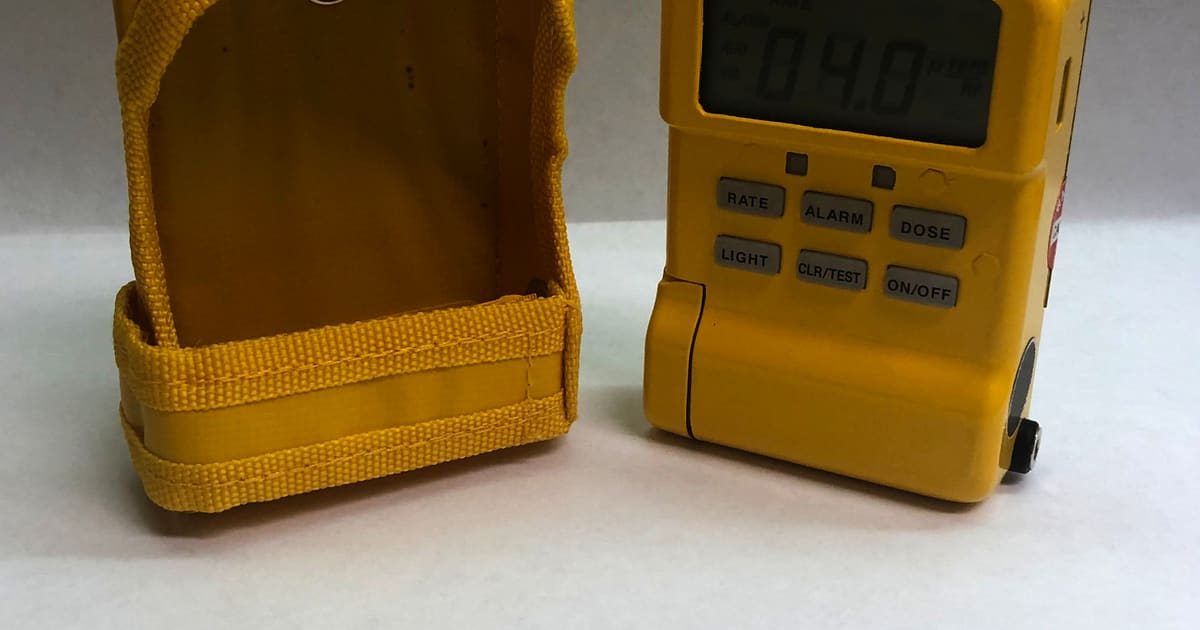
A dosimeter tracks accumulated dose to the wearer; it does not automatically describe every person's dose in the same area. Source image: Jphill19 via Wikimedia Commons, CC BY-SA 4.0.
The most durable habit is to translate every number into a sentence: "This is a whole-body effective dose of X over Y time," or "This is a dose rate at this location right now." If you cannot write that sentence, do not over-interpret the number.
How can households use a radiation dose chart?
Households should use a radiation dose chart as a decision filter, not as a substitute for medical or emergency guidance. The chart helps you recognize scale. It can tell you that a routine x-ray comparison is not the same as a fallout dose-rate warning. It can also tell you that a meter reading must be paired with time and location before it becomes a personal dose estimate.
Household interpretation protocol
- Identify the unit: mSv, rem, Gy, rad, uSv/h, mSv/h, R/hr, or CPM.
- Determine whether it is dose or dose rate.
- Estimate time exposed only if conditions were stable.
- Check whether the dose is whole-body, local, internal, or external.
- Follow official instructions for shelter, decontamination, evacuation, and medical evaluation.
This protocol is especially important during fast-moving alerts because early numbers can be partial, local, or stale. A single detector reading outside your building may not describe the center of your basement, a different neighborhood, or a route that authorities are monitoring.
How should responders and planners explain dose numbers?
Public communication should turn dose numbers into actions. Saying "20 mSv projected dose" may be technically correct, but most people need the operational sentence: remain sheltered, prepare to relocate, avoid a specific corridor, or seek medical screening.
Clear public-dose language
| Technical phrase | Public-facing version |
|---|---|
| Projected dose over four days | What you may receive if you stay or move as modeled |
| Dose rate at monitoring point | How fast dose is accumulating at that location now |
| Accumulated dose | What a person or dosimeter has already received |
| Protective action guide | Dose-based trigger used with practical emergency tradeoffs |
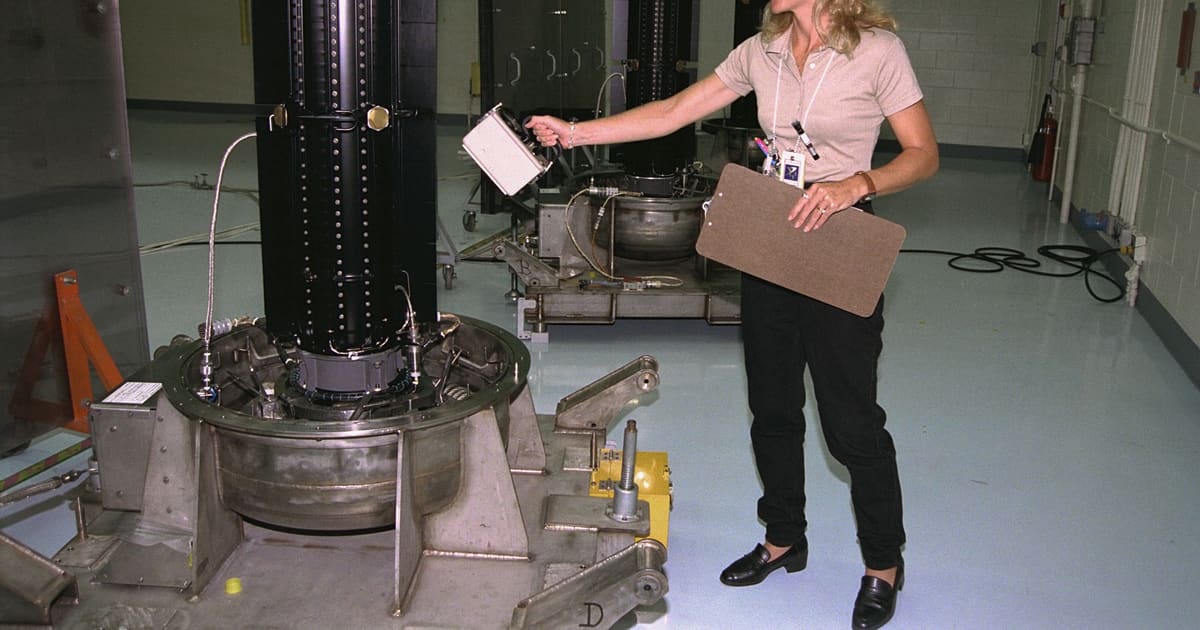
Radiation measurements become useful when source, location, instrument, and exposure time are recorded together. Source image: NASA via Wikimedia Commons.
Good crisis messaging avoids both extremes: "everything is fine" and "any radiation is catastrophic." It explains the dose scale, the protective action, the review time, and where the next verified update will appear.
Bottom line: what should a radiation dose chart change?
A radiation dose chart should change how you interpret numbers. It should stop you from equating normal background exposure with acute injury, and it should stop you from dismissing high dose-rate readings because the unit looks unfamiliar. The practical middle ground is disciplined translation: unit, time, body area, pathway, and action.
For nuclear emergencies, the stable sequence remains: shelter first, improve shielding, reduce contamination, monitor official channels, and use dose numbers to understand instructions. For medical imaging, ask clinicians about benefit, alternatives, and cumulative history. For worker exposure, rely on trained radiation protection programs and personal dosimetry.
If you remember one conversion and one caution, make them these: 1 mSv equals 100 mrem, and dose rate is not dose until you know the time.