Radiation Sickness Symptoms Timeline: Hour-by-Hour Warning Signs
Radiation sickness symptoms timeline explained: onset windows, stage-by-stage signs, dose ranges, and the treatment decisions that most affect survival.
Staff Reporting and Analysis. Produces source-backed reporting, explainers, and reference pages on nuclear risk, proliferation, and escalation dynamics.
Key Sources
Start with the strongest supporting documents and reporting behind this page.
Where This Matters Now
Recent articles where this concept is actively shaping the current crisis.
In Current Coverage
Nuclear Threat Assessment: Where the Iran Crisis Goes From Here
A scenario-based nuclear threat assessment of the Iran crisis, including leadership instability, damaged facilities, and pathways to escalation or containment.
2026-03-03
In Current Coverage
US-Israeli Strikes Hit Fordow, Isfahan, and Natanz
US and Israeli strikes targeted Iran's key nuclear facilities at Fordow, Isfahan, and Natanz during Operation Epic Fury, with damage extent still uncertain.
2026-03-03
In Current Coverage
Hiroshima and Nagasaki: What Happened When the Bombs Fell
On August 6 and 9, 1945, U.S. atomic bombs devastated Hiroshima and Nagasaki. Here is what happened, who died, and what radiation did after.
2026-03-03
Related Concepts
Companion explainers that deepen the strategic logic around this topic.
Concept
Dirty Bomb vs Nuclear Bomb: Key Differences
Dirty bomb vs nuclear bomb explained: hazard size, radiation risk, survival steps, and when to shelter or evacuate based on official guidance.
2026-03-11
Concept
Radiation Dose Chart: Levels and Risks
Radiation dose chart guide: compare mSv, rem, Gy, symptoms, and emergency action thresholds before you act.
2026-05-27
Concept
Nuclear Fallout Map: How to Read One
Nuclear fallout map guidance: read wind plumes, timing, and shelter zones without false certainty. Learn the signals that matter.
2026-05-13
Radiation sickness symptoms timeline decisions are time-critical because the first symptom window helps clinicians estimate dose severity before lab data is complete. Public guidance from the CDC, WHO, and Merck Manual aligns on one core point: symptom onset speed, vomiting frequency, and blood-count decline together predict which patients need urgent specialty care and which can be managed with lower-intensity monitoring.
How soon do radiation sickness symptoms start?
The earliest symptoms can begin within minutes to hours, but onset varies by dose, exposure type, and whether the whole body was irradiated or only a partial area. In acute radiation syndrome (ARS), clinicians often treat early vomiting as a rough severity marker: the shorter the interval to vomiting, the higher the likely absorbed dose.
Practical onset windows used in triage
| Time after exposure | Common findings | Operational meaning |
|---|---|---|
| 0-1 hour | Sudden nausea, repeated vomiting, severe fatigue, headache | Suggests potentially high dose and immediate high-acuity triage |
| 1-6 hours | Nausea, one or more emesis episodes, weakness, anxiety | Moderate to severe exposure possible; needs serial monitoring |
| 6-24 hours | Mild nausea, transient fatigue, minimal vomiting | Lower but still meaningful exposure possible |
| 24+ hours | No early GI symptoms does not rule out injury | Watch for delayed marrow suppression and infection signs |
A key mistake is waiting for dramatic symptoms before seeking care. Some patients enter a temporary "better" phase after initial illness, then worsen as marrow and gut injury evolves. That is why timeline tracking beats single-moment impressions.
If you need immediate household actions before medical systems engage, use What to Do During Nuclear Alert and Nuclear Shelter Checklist first. This page covers the clinical progression after suspected dose exposure.
What are the stages of acute radiation syndrome?
Most ARS descriptions use four stages: prodromal phase, latent phase, manifest illness phase, and either recovery or death. The duration of each phase shortens as dose increases.
1. Prodromal phase (minutes to 2 days)
This is the "early warning" period. Typical symptoms include nausea, vomiting, anorexia, fatigue, and sometimes diarrhea. Fever early in this phase can indicate a higher risk profile.
2. Latent phase (hours to weeks)
Symptoms may partially improve, creating false reassurance. Biologically, however, stem-cell and tissue injury can be progressing. Dose category drives how long this phase lasts.
3. Manifest illness phase (days to weeks)
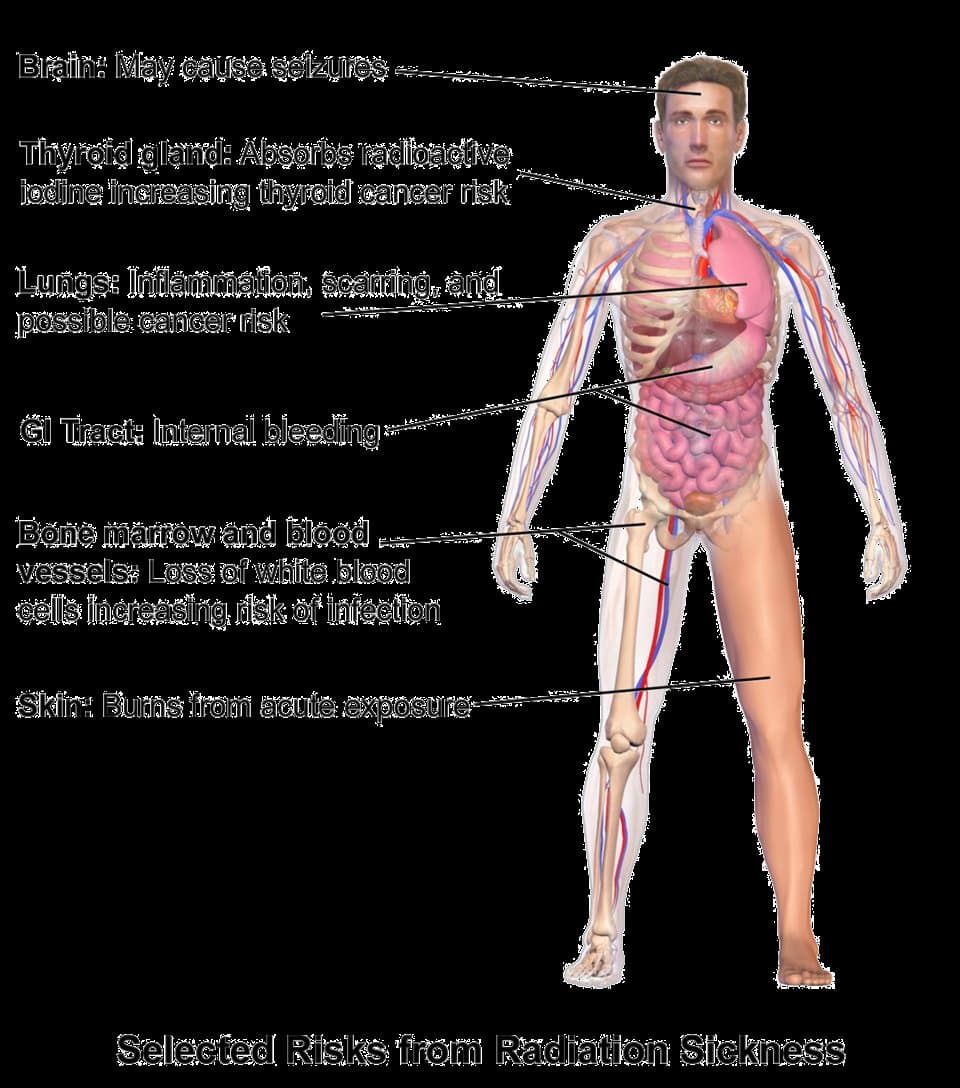
This phase reflects which organ systems took the most dose burden:
- hematopoietic syndrome (bone marrow suppression),
- gastrointestinal syndrome (fluid loss, sepsis risk),
- neurovascular syndrome (very high dose, rapid decline).
4. Recovery or fatal progression
With lower doses and aggressive supportive care, marrow can recover over weeks to months. At very high doses, multi-organ failure can develop despite treatment.
The stage model matters because it guides staffing and supplies. Hospitals need antiemetics in the first wave, then blood-product logistics and infection-control resources as marrow failure emerges.
What dose of radiation causes severe symptoms?
Dose-response is not perfectly linear person to person, but population-level ranges are clinically useful. Values below are approximations using gray (Gy), where 1 Gy equals 100 rad.
| Whole-body dose (Gy) | Typical syndrome pattern | Broad survival expectation with care |
|---|---|---|
| <1 Gy | Mild or no early symptoms; transient blood-count changes | High survival probability |
| 1-2 Gy | Mild to moderate prodromal symptoms; marrow effects possible | Usually survivable with monitoring |
| 2-6 Gy | Clear hematopoietic syndrome; infection and bleeding risks | Survival possible with strong supportive care |
| 6-10 Gy | Severe GI injury plus marrow collapse | Survival uncertain, resource intensive |
| >10 Gy | Neurovascular/GI dominance, rapid deterioration | Low survival likelihood |
Dose estimates are triage tools, not exact personal predictions
Field estimates can change after biodosimetry, serial CBC trends, and contamination assessment. Early overconfidence leads to under-triage.
This is also why public debate about "survivable" events is often misleading. Survival is not just dose; it is dose plus time-to-care, antimicrobial access, fluids, transfusion capacity, and isolation discipline.
Why does the timeline include a "latent phase" that feels better?
The latent phase is one of the most dangerous interpretation traps in radiation incidents. Symptoms can temporarily decrease even while marrow stem cells and GI lining continue to fail at the cellular level.
Clinical and operational implications
| Observation | Wrong interpretation | Better interpretation |
|---|---|---|
| Vomiting stops for several hours | "Exposure was minor" | Could still be moderate or severe dose |
| Patient reports "feeling fine" after initial nausea | "Discharge now" | Continue serial CBC and symptom surveillance |
| No fever yet | "No infection risk" | Neutropenia may not have emerged yet |
For emergency managers, this phase complicates surge forecasting. Caseload can appear to improve, then rebound with higher acuity 2-7 days later. Planning should stage staffing in waves rather than assuming day-1 counts reflect final severity.
What does the hematopoietic phase look like day by day?
Hematopoietic injury is often the main driver of medium-term mortality because marrow suppression increases infection and bleeding risk. Symptom progression typically looks like this:
Day 1-2
- Early GI symptoms may persist or improve.
- Absolute lymphocyte count may begin dropping.
- Patients can still look clinically stable.
Day 3-7
- Falling neutrophils increase infection vulnerability.
- Fatigue deepens as marrow output declines.
- Mouth ulcers and low-grade fevers may appear.
Day 7-21
- Neutropenic infections, sepsis risk, and bleeding complications rise.
- Platelet decline can produce petechiae, bruising, or mucosal bleeding.
- Intensive supportive care becomes decisive.
After 3 weeks
- Recovery trajectory depends on dose and treatment speed.
- Survivors may still face prolonged immune and hematologic instability.
This phase is why timeline literacy matters for civilians too. A person who "felt better yesterday" may need more urgent care today.
When does gastrointestinal radiation syndrome begin?
GI syndrome usually appears at higher doses than isolated marrow injury, with onset ranging from several hours to a few days depending on absorbed dose. Hallmarks include persistent vomiting, severe diarrhea, dehydration, electrolyte imbalance, and barrier breakdown that increases bloodstream infection risk.
GI timeline checkpoints
| Time window | Typical GI findings | Care priority |
|---|---|---|
| First 24 hours | Recurrent emesis, abdominal cramping | Aggressive antiemetics + fluids |
| 24-72 hours | Diarrhea, worsening weakness, dehydration | Electrolyte correction, infection prevention |
| Day 3-10 | Severe mucosal injury, sepsis risk | Broad-spectrum antimicrobial strategy and high-acuity monitoring |
In mass-casualty settings, GI-dominant presentations consume resources quickly because they need fluids, isolation, nursing intensity, and frequent reassessment. That is why incident plans should include realistic assumptions about bed turnover and infusion supply chains.
Can you survive radiation sickness?
Yes, many people can survive depending on dose and care access. Survival probabilities improve sharply when triage is fast, contamination is controlled early, and infection/bleeding support is available before marrow failure peaks.
Main factors that change outcomes
- Absorbed dose and body area exposed: Partial-body exposure can be less lethal than full-body high-dose exposure.
- Time to evidence-based care: Antiemetics, hydration, and infection control in the first day matter.
- Hospital capability: Availability of blood products, growth factors, and isolation infrastructure is critical.
- Comorbid conditions: Baseline immune or renal disease can worsen prognosis.
- Concurrent trauma/burns: Combined injuries reduce survival odds significantly.
A practical framing is "dose sets the slope, care sets the endpoint." Dose determines how steep decline can be, but care quality changes whether decline is interrupted.
For larger scenario context, What Would Happen If Nuclear War Started? explains why medical-system stress, not only blast radius, drives total casualties.
What should happen in the first 24 hours after suspected exposure?
The first day is not about perfect diagnosis; it is about preserving options. Strong first-24-hour execution reduces later mortality.
First-24-hour action framework
| Priority | Action | Why it matters |
|---|---|---|
| 1 | Move to proper shelter and stop further exposure | Prevents additive dose |
| 2 | Remove outer clothing and wash exposed skin | Reduces external contamination burden |
| 3 | Document symptom onset time (especially vomiting) | Supports rapid dose stratification |
| 4 | Start serial clinical assessment and CBC trend tracking | Early objective severity signals |
| 5 | Activate official guidance channels | Aligns care with incident-specific public health orders |
For households, this intersects with Nuclear Fallout Explained: shielding and contamination control come before rumor-driven travel.
Do not self-medicate with random products labeled as anti-radiation
Unapproved products can delay real treatment and create toxicity. Follow official medical guidance and licensed clinical protocols.
How do clinicians estimate severity before full lab results?
Early triage combines symptom timing, physical findings, and simple repeated labs rather than relying on one perfect test.
Common early severity indicators
| Indicator | Lower concern pattern | Higher concern pattern |
|---|---|---|
| Time to first vomiting | >4-6 hours | <1-2 hours |
| Vomiting frequency | Single or brief | Repeated/persistent |
| Early neurologic signs | Mild headache/anxiety | Confusion, ataxia, severe hypotension |
| Lymphocyte trend (serial) | Slow decline | Rapid decline over first 24-48h |
| Combined injuries | None | Significant burns/trauma plus exposure |
No single indicator is definitive, but combined trends improve triage accuracy. In crisis communication, the public often expects instant certainty. Real clinical systems work through probability bands and repeated reassessment.
How historical events inform the modern timeline model
Modern ARS timelines are shaped by multiple evidence streams: Hiroshima/Nagasaki survivor follow-up, Chernobyl worker data, radiological accident case reports, and controlled medical literature. The IAEA Chernobyl archive and WHO analyses are especially important for understanding delayed cancer patterns vs immediate syndrome progression.
What history changed in practice
- Earlier antiemetic and fluid protocols improved early stabilization.
- Better infection-control protocols reduced neutropenic mortality in treatable dose ranges.
- Structured triage frameworks now prioritize symptom timing documentation from first contact.
- Public guidance emphasizes rapid sheltering because preventing additional dose is often more valuable than late relocation.
This is one reason preparedness content on NukeClock increasingly links strategic and civilian layers. Understanding deterrence and escalation is useful, but so is knowing what day-3 marrow suppression means in practical terms.
What mistakes cause avoidable deaths in radiation incidents?
Most avoidable harm comes from process errors, not obscure medicine. The recurring failures are operational:
| Failure mode | Why it is dangerous | Better standard |
|---|---|---|
| Delayed sheltering while seeking more news | Adds preventable dose | Shelter first, verify second |
| Ignoring early emesis timing | Loses key triage signal | Record exact symptom timeline |
| Premature discharge during latent phase | Misses delayed marrow collapse | Require scheduled reassessment |
| Resource misallocation in hospitals | High-risk patients lose early support | Use dose/symptom tiering from intake |
| Rumor-based self-transport across long distances | Increases contamination spread and delay | Follow official route and facility guidance |
A communication plan that includes one designated family verifier and one clinical note keeper can materially improve outcomes in real events.
How to interpret public updates without panic
Radiation incidents generate high-noise information environments. Better public behavior depends on source hierarchy and timeline literacy.
Credibility hierarchy for civilians
- Local emergency management and public health departments.
- Federal agencies with incident updates (CDC, Ready.gov).
- International technical agencies for broader context (IAEA, WHO).
- Secondary commentary and social media clips.
The practical rule: trust instructions tied to place and time over generalized viral advice.